Programming is a complex and complicated task that sometimes seems everything is going wrong or not working as intended. The code may not execute properly because of nagging bugs.
Every seasoned professional programmer has to deal with bugs in some fashion while coding software. Some estimate that up to 75% of a programmer’s time is spent debugging code.
Developers who understand effective debugging techniques can save valuable time and, in the process, deliver better products.
Tips on Debugging Code Like a Pro
Why is there so much emphasis on being able to conduct software testing for functionality and any bugs? Considering how much time is lost debugging and fixing software, there are many reasons for being able to debug software professionally. According to the data analytics company, Coralogix, the cost and labor for debugging:
- On average, implemented code contains 15 bugs per 1,000 lines.
- Developers average 70 bugs per 1000 lines of code.
- Bug fixes require 30 times the labor than a line of well-written code.
- Developers spend up to 75% of their time debugging.
- Identifying and fixing product bugs and problems costs $113B alone in the U.S.
Top 10 Debugging and Troubleshooting Techniques
Now we will discuss some important debugging and troubleshooting techniques you can follow with the availability of the tools, internet websites, and AI technology.
1. Analyze the code piece by piece
Dissecting the code piece by piece and checking variable values is a great way to debug code. In addition, placing breakpoints in the coding allows you to check the variable values and confirm their intended functionality or expose wrong values.
2. Isolate and understand problems by reproducing them
Try to isolate issues by examining exception reports and error messages. You should resolve the issue by gleaning information and understanding it. Reproducing coding problems with software testing is a great troubleshooting technique for discovering and resolving issues.
3. Utilize debugging tools to discover coding errors
Most programming languages use a debugger or data logger to catch errors. These tools provide a means of examining code line by line to verify expected behavior or detect errors. Also, memory leak detectors or profilers can be used to determine if any memory issues are causing programming or performance issues.
- Select the best debugging tool – The most successful debugging depends on the tool most suited to your specific programming language. Ensure you have the best debugging tool for your particular job.
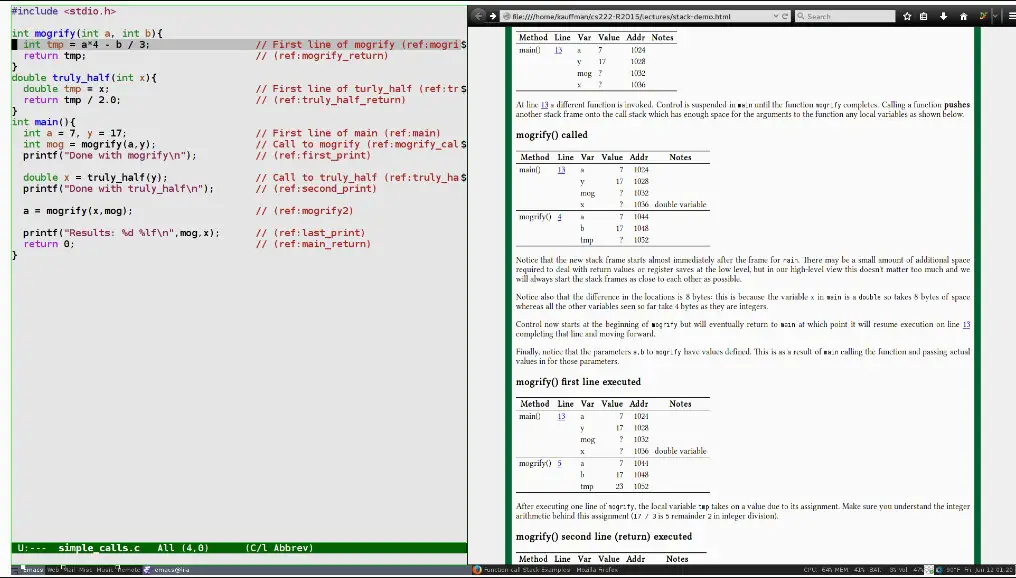
- Use debugging tools “call stacks” and “variables” – The function and benefits of the debugging tool “variables” have been previously discussed. Another powerful debugging tool to use is “call stacks.” Call stacks are a tool that maintains the parameters and local variables used during the execution of a function. They have been traditionally a key component of C programming but are becoming more popular with modern languages such as Visual Studio and Eclipse. This is an example of a simple call stack function:
4. Use ChatGPT for suggestions and tips
The advent of ChatGPT, with its enormous data bank of information, is a powerful reference tool. The OpenAI language model has vast data and provides many suggestions and tips for debugging coding projects. ChatGPT may have the advice you are looking for. It might also already have written code available to fix a debugging error.
Read Also: How to write or reply to emails with ChatGPT in Outlook
5 Unit testing of small sets of code
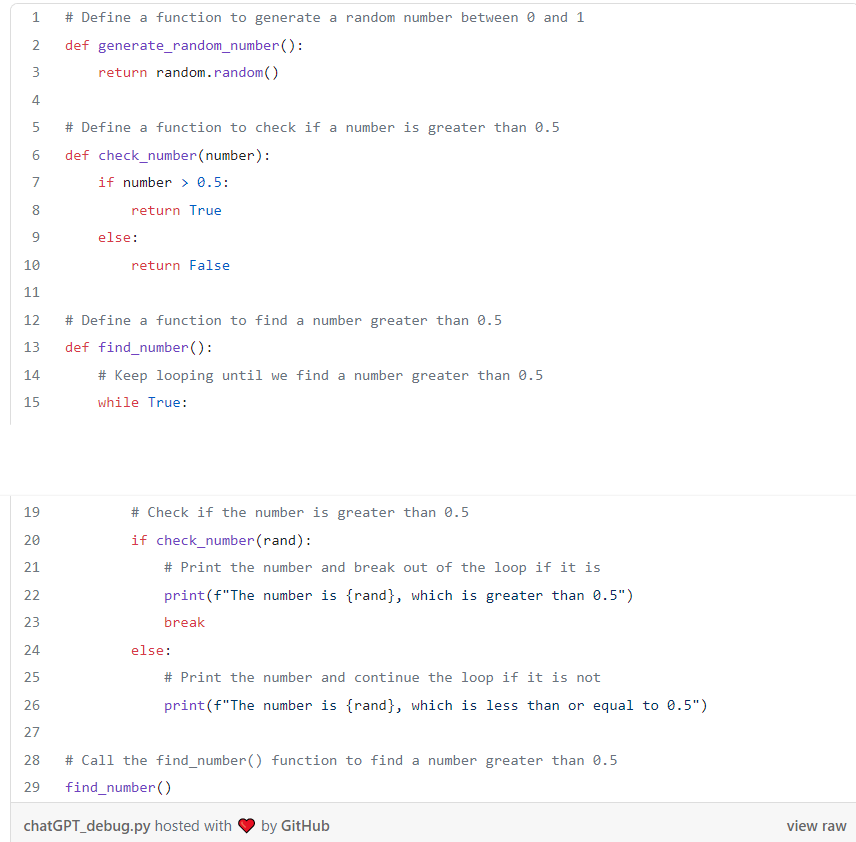
The procedure of unit testing allows testing certain sets of code while debugging to discover any bugs that can automatically run while testing the code. Different code sets are examined together, exposing any inherent coding bugs. An example of ChatGPT for coding suggestions:
6. Create documentation of your code
Make sure to create good documentation of your code. Documentation written correctly should be like a good block of code. The following suggestions and these excellent software testing references will help with your code documentation.
- Know the documentation audience – Understand the intended audience for the documentation. Knowing if the documentation is for developers or a more extensive audience may provide a blueprint for the complexity of creating the documentation.
- Describe and list dependencies – List the primary features and any dependencies the elements may require.
- Create a short and definitive background of the build – Writing a descriptive background defining the main points of your build will help other parties understand the feature’s relevance to what they need.
- Create time stamps and versioning of the project – Validate your documentation using timestamps, including any library dependencies and versioning.
- Use coding examples detailing expected results – Explain how your features should work and showcase any desired results.
7. Use binary search to find coding bugs
Searching through thousands of lines of code for a complex error can be a real challenge. It may be necessary to search in multiple places and require using binary search for a bug. Cutting out large sections of code and running the code in two parts may be a faster method to examine the code.
Commenting out some parts and then running the other parts of the code may expose the bug. Keep repeating the process until the lines of code that caused the error are discovered.
8. Create log statements to validate code execution
Using a log statement for debugging can save valuable programming time. By creating log statements with information about the program, you can validate how correct code execution is being performed. In addition, understanding the program’s state at various points can significantly assist in finding the bug.
9. Make sure the correct versions are deployed
It is easy to deploy incorrect versions of an application while verifying that it works as designed. Therefore, cross-verifying that all versions are correct when evaluating the process is essential and saves time dealing with the wrong version of the application.
10. Talk with others familiar with the code base
Talking to anyone familiar with the code base and how the program was designed to function can save a developer’s time.
We discussed key points and techniques for utilizing cutting-edge technology to troubleshoot and rectify programming code proficiently. Familiarity with these capabilities and resources can facilitate the development of flawless applications and software.